
In sales and marketing, not all customers are equal. Some buy often, some spend big, and others have disappeared completely. So how do you identify your best customers — and bring back the ones you’re losing?
Enter RFM Analysis: a simple yet powerful method to segment your customers based on how they behave.
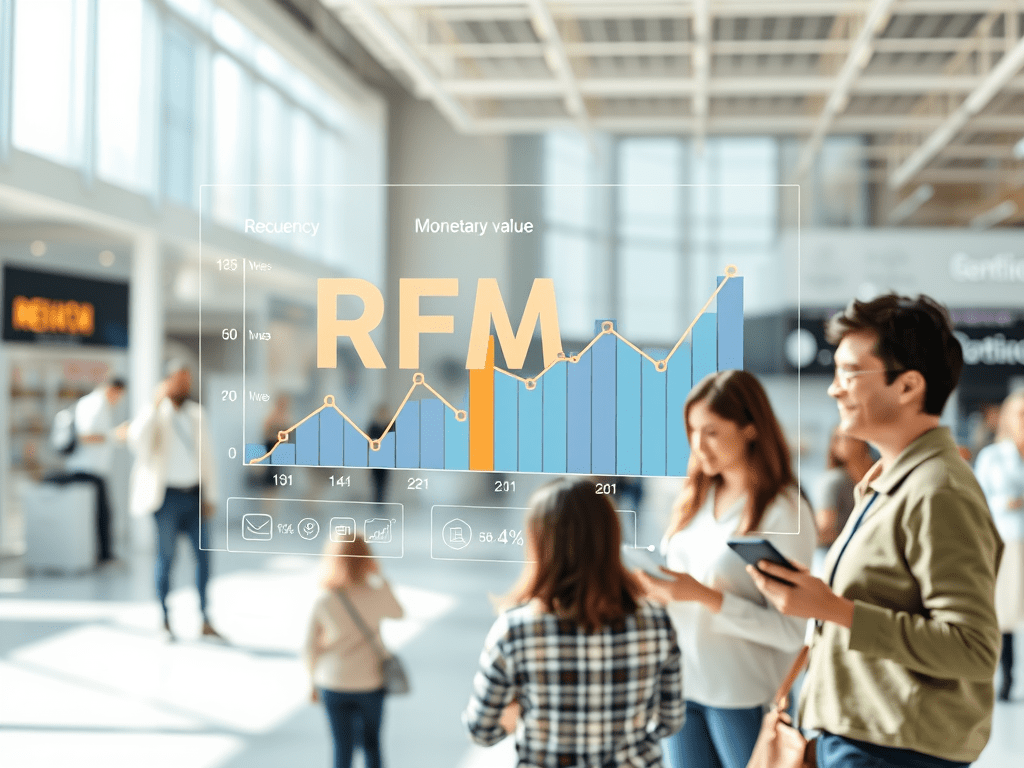
🔍 What Does RFM Stand For?
RFM stands for:
| Metric | What It Measures | Why It Matters |
|---|---|---|
| Recency | How recently a customer purchased | Recent buyers are more likely to buy again |
| Frequency | How often they purchase | Loyal customers bring recurring revenue |
| Monetary | How much they spend | Big spenders deserve VIP treatment |
Together, these three dimensions give you a full picture of customer value and engagement.
🎯 Why RFM Analysis Matters
RFM helps you:
- Identify your champions (frequent and high-value buyers)
- Spot customers at risk of churning
- Create personalized marketing strategies
- Improve customer retention and profitability
Instead of guessing who to target, you let the data guide you.
🧮 How RFM Analysis Works
Let’s say you have a list of customers and their purchases.
- Recency: How many days since their last purchase?
- Frequency: How many orders have they made?
- Monetary: What’s the total they’ve spent?
You then score each customer on each metric from 1 (low) to 5 (high):
| Customer | Recency (days) | Frequency | Monetary ($) | R | F | M |
|---|---|---|---|---|---|---|
| Alice | 3 | 10 | 1200 | 5 | 5 | 5 |
| Bob | 120 | 2 | 300 | 1 | 2 | 2 |
| Carol | 45 | 5 | 650 | 3 | 4 | 4 |
You then combine the scores into a string like “555” or “124” — this is their RFM score.
🧠 What Do These Scores Mean?
| RFM Score | Segment | Suggested Action |
|---|---|---|
| 555 | 🏆 Champions | Reward, retain, and upsell |
| 155 | 🚀 New Big Spender | Encourage early loyalty |
| 511 | 🌱 Potential Loyal | Nurture with offers or loyalty programs |
| 111 | 💤 At Risk / Dormant | Win-back campaigns, email re-engagement |
These scores become the basis for targeted strategies, not one-size-fits-all campaigns.
💡 Use Cases in the Real World
- E-commerce: Target high-RFM customers for early access to new products
- Retail: Send personalized coupons to dormant buyers
- Subscription business: Retain high-frequency customers with VIP perks
- Jewelry: Identify high-spenders for exclusive designs
🛠️ How to Perform RFM Analysis in Python
Here’s a mini version using pandas:
import pandas as pd

# Read your sales data
df = pd.read_csv("sales.csv")
df['InvoiceDate'] = pd.to_datetime(df['InvoiceDate'])

# Define snapshot date (today + 1)
snapshot = df['InvoiceDate'].max() + pd.Timedelta(days=1)

# Aggregate RFM metrics
rfm = df.groupby('CustomerID').agg({
    'InvoiceDate': lambda x: (snapshot - x.max()).days,
    'InvoiceNo': 'nunique',
    'Amount': 'sum'
})
rfm.columns = ['Recency', 'Frequency', 'Monetary']

# Score them
rfm['R'] = pd.qcut(rfm['Recency'], 5, labels=[5,4,3,2,1])
rfm['F'] = pd.qcut(rfm['Frequency'].rank(method='first'), 5, labels=[1,2,3,4,5])
rfm['M'] = pd.qcut(rfm['Monetary'], 5, labels=[1,2,3,4,5])

# Combine RFM score
rfm['RFM_Score'] = rfm['R'].astype(str) + rfm['F'].astype(str) + rfm['M'].astype(str)
You can now use this to build dashboards, send targeted campaigns, or analyze customer value tiers.
R-code
# Load libraries
library(tidyverse)
library(lubridate)

# Step 1: Load the data
sales <- read_csv("sales.csv")

# Step 2: Convert date column to Date format
sales <- sales %>%
  mutate(InvoiceDate = as.Date(InvoiceDate))

# Step 3: Define snapshot date (for Recency)
snapshot_date <- max(sales$InvoiceDate) + 1

# Step 4: Aggregate RFM metrics
rfm <- sales %>%
  group_by(CustomerID) %>%
  summarise(
    Recency = as.numeric(snapshot_date - max(InvoiceDate)),
    Frequency = n_distinct(InvoiceNo),
    Monetary = sum(Amount),
    .groups = "drop"
  )

# Step 5: Assign RFM scores (1 to 5)
rfm <- rfm %>%
  mutate(
    R_Score = ntile(-Recency, 5),      # Recency: lower = better
    F_Score = ntile(Frequency, 5),
    M_Score = ntile(Monetary, 5),
    RFM_Score = paste0(R_Score, F_Score, M_Score)
  )

# Step 6: Export result to CSV for Power BI
write_csv(rfm, "rfm_scores.csv")

# Optional Preview
print(head(rfm))
📈 Visualizing RFM in Power BI or Tableau
Ideas for visualization:
- Heatmap of RFM segments
- Bar chart of revenue per RFM score
- Filters to explore customer groups by activity
- KPI cards showing % of revenue from top segments
🧾 Final Thoughts
RFM analysis turns raw purchase data into actionable insights. Whether you’re running an online store or analyzing enterprise sales, it helps you:
- Focus on your best customers
- Bring back those you’re losing
- Spend less on irrelevant marketing

Leave a comment